This report represents the most comprehensive dataset on equity, diversity and inclusion in our industry, in the UK to date. It provides an overview of diversity data collection, including a demographic snapshot of the industry’s workforce. The report also explores how data can be used to inform EDI strategies, aiming to foster inclusivity and attract and retain diverse talent in the industry.
Last year’s intent to assess the pulse of equity, diversity and inclusion progress across the industry is yielding its first fruits. Tangible improvements in data collection, response rates, and the consolidation of year-on-year trends from the second consecutive year of research reflect continued efforts in this space. EDI is one of those soft factors increasingly influencing organisational success and investment performance. The insights revealed today have the potential to uncover hidden drivers and patterns for tomorrow. This study looks to the future – to the organisations of tomorrow.
Marisa Hall, Head of the Thinking Ahead Institute
Key findings
On firms’ data collection:
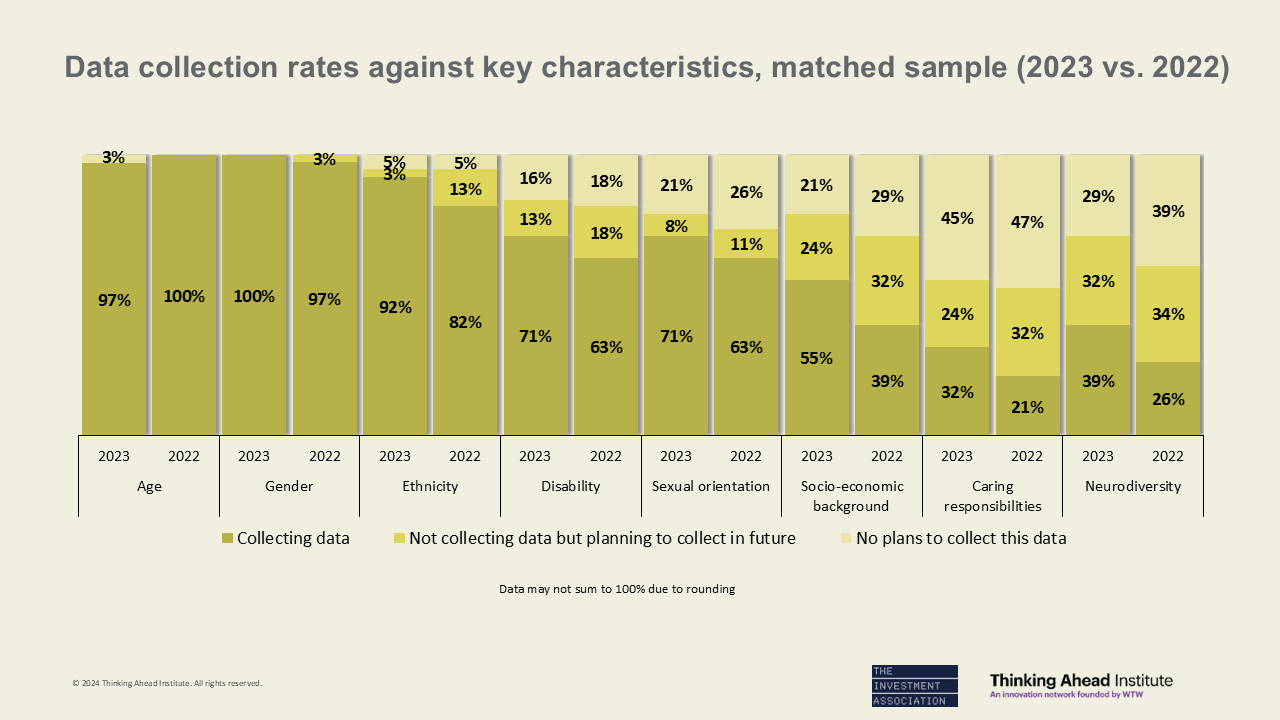
- Firms are collecting data against a wider set of characteristics compared with 2022, with over 60% of respondents collecting data across at least 6 of the 8 characteristics listed above
- Age (97%), gender (100%), and ethnicity (92%) have the highest response rates, and an increasing number of firms are now also collecting data on disability (71%), sexual orientation (71%), and socio-economic background (55%)
- The top motivations for data collection are commitment to fostering a positive and inclusive culture (92%), tracking against internally set diversity targets (66%) and compliance with current or future regulation (61%)
On the demographic make-up of the industry:
- The industry’s workforce is relatively young, a feature consistent with last year’s data, with just over a third (34%) under 35
- 41% of investment management employees are female, a two-percentage-point increase since 2022, and 53% are male
- The industry makeup stands at 62% white employees, 10% Asian, 3% black and 2% from a mixed ethnicity background. The non-disclosure rate for ethnicity is 18%
Related pages
Research paper: Culture – the organisational superpower
Research paper: The Power of Culture
Investment insight: Raising our game: from gender diversity to embracing whole identity
Research paper- WTW: Diversity in the asset management industry: on the right track, but at the wrong pace
Investment insight: Diversity means embracing whole identity
Research paper: Better decision-making: a toolkit
Investment insight: Prime time for investment superteams